A Sprint Retrospective

The IT Ops team’s 4th sprint came to its conclusion recently… and we delivered all of our commitments! Huzzah! This post is basically a summary of how we analysed the sprint and what we got up to in the retrospective.
The main objectives of this sprint were:

  • Rolling out a new password policy
  • Rolling out a new file server
  • Rebuilding the dev db

In addition to these tasks there were a bunch of other smaller tasks, far too dull for me to list here.

This was the first time we’d completed all of our committed points, and it gave us enough information to work out how many points we can realistically attempt to deliver in each sprint.
Once again the team completed over 100 points in the sprint, and once again we committed to doing 50 project points (the other 50-or-so being unplanned interruptions).

Sprint 4 in Numbers:

sprintNumbers
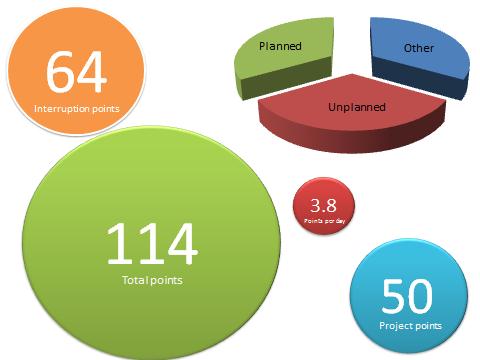
We completed 50 committed points
We completed 64 unplanned points
Total: 114 points
That’s very much in-line with the total we’ve come to expect.
We averaged 3.8 points per person per day for the duration of the sprint.

This means that we’re able to do roughly 2 points per person per day on committed project work.
In an ideal scenario, with no interruptions, no meetings and nothing to distract us from our tasks, we estimate that we could do about 6 points per person per day.
Therefore, statistically speaking, were actually 33% productive on our project work.
Of the remaining 67% we spent another 33% on interruptions.

So what happens to the other 33%??
The remaining effort and time is taken up with meetings, discussions, unrecorded interruptions, emails, phone calls and unproductive time. This figure (33%) is in the region of what I expected before we embarked upon this process some 8 weeks ago.

How to use this information
Well we know that we can complete approximately 50 project points per sprint. So we can now break down upcoming projects into tasks, and give realistic predictions on when they can be delivered.
The only caveat is that we do not make guarantees on project priority. We will always commit to working on delivering the highest business value projects first, and as a result will take guidance from the business on priorities. If a project’s priority is lowered then it will likely drop down the pecking order of our tasks, and its delivery date will slip.
In short, providing project priorities don’t chance for the duration of the project, we can now give far more realistic predictions on delivery dates.

Retrospective
To get the creative juices flowing, we started the retrospective with everyone drawing a picture of Sprint 4. There were no rules to this task, we could draw anything we wanted that represented sprint 4 for us as individuals.

Here’s the resulting “artwork”, if you can call it that:

Farud

Farid, who for some reason I expected to be something of an artist, drew a picture of the Jules Rimet trophy. This was partly to represent the fact that we completed the Password and File server projects, and partly to reflect that we hit our target.

nick

Nick’s “effort” was of a question mark going into a grinder with a gold bar coming out of the other end. This reflects the fact that we’re not 100% sure of what’s happening up front at the beginning of our sprint, and we base our estimations on “best-guesses”, but by the end of the sprint we were producing the goods. It also raises a very relevant point about how we know we are addressing the right projects/tasks in the right order. More on that later.

boss

Jon (in his unique avant-garde style) drew a person wearing a Boss hat. The person represents the team, and the boss hat is representative of the fact that we all completed our tasks on time and delivered what we committed to. Or at least that was his explanation, although I suspect it has more to do with the Lonely Island “Like a Boss” video, which is something of a theme tune in the IT Ops team. Seriously.

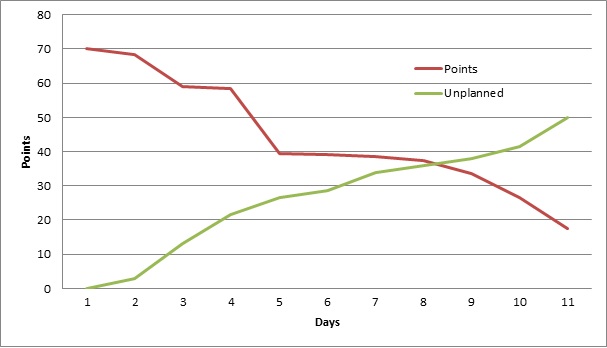
Leo drew the burndown, the original of which you can find at the bottom of this post.

Next up, we all chose 1 thing from the sprint that we wanted to discuss in more detail. Here’s what we ended up speaking about:
1. Using small post-it notes to record interruptions on the board didn’t work. They’re too small and not sticky enough. This was a major issue for Leo and Jon, who clearly have something against post-it notes.
2. We need to plan more carefully. Our planning sessions are rushed, and as a result we don’t think our tasks through as well as we should. The main failure here is that we don’t think about the impact other people can have on our tasks.

Following this, we discussed what we think went well, and what we think went badly in the sprint:

WENT WELL

  • Better prioritisation of interruptions allowed us to concentrate on the
  • committed tasks
  • Implementing the password policy
  • Realistic goal setting

WENT BADLY

  • IT request backlog grew bigger

What did we learn from Sprint 4:

  • 50 Project points is our magic number
  • Don’t over-commit
  • Do more forward planning
  • Our prioritizing is getting better

Finally we discussed the stats and figures mentioned earlier, and then we looked back at the burndown to see if there was any useful information we could take from it.
Leo suggested that the burndown be pre-populated with the mean line, so that we can see our daily deviation from that line. I have filed this suggestion in a folder named “Leo’s Good Ideas”, and we’ll adopt it in future sprints once I’ve worked out how to use Excel properly (or found a pen and a ruler).

The Burndown

s4burn


Improvements
As mentioned earlier, we’ve worked out what our average velocity is – and we can now confidently say that 50 project points per sprint is a realistic target for the team. Now that we’ve established this, we need to turn our attention to ensuring that we’re delivering the highest business value we possibly can. At present we feel we are slightly deficient in engaging with the business to define our priorities, so in the future we’ll be looking at having a much closer engagement with the rest of the business to help us with our prioritising and acceptance criteria. We want to be delivering the most important projects first, and we want to have a clear picture of what a successful delivery of those projects looks like.
Over the next couple of sprints we’ll be shifting our focus in this direction, and hopefully people will start to see the results over the next few weeks.

P.S. Jon is available for hire as a short order artist, ideal for weddings and birthday parties. Disappointment guaranteed.

Advertisement

ITOps Sprint 1 Review

Our first ever ITOps sprint completed on Friday 7th December amid much fanfare and celebration (ok, that’s a bit of an exaggeration). The team completed a whopping grand total of 103 points. Among the highlights were:

  • An Anti-Virus upgrade
  • A new dev server
  • 10+ IT Requests from the backlog

Yes, those were the highlights. But don’t scoff – that new dev server was AMAZEBALLS.

Retrospective

The format of our first retrospective was to spend 5 minutes writing down (on cards) what we felt went well in our first sprint, and what went not-so-well. We then discussed these and made a list of “lessons learned”. It turned out a bit like this:


What went well What went not-so-well
2 week “focus” made a huge difference: we could concentrate on a smaller number of tasks, rather than work from a massive backlog with no end in sight. We under-estimated task sizes. Massively, in some cases.
Having the tasks on the board helped us see what everyone was doing 7 point task sizes were waaaaaaaaaaay too large
When working on a task, we no longer felt that we perhaps ought to be working on something else We did fewer IT requests than we would otherwise have done
Time-boxing certain IT requests was a good idea. We didn’t take holidays into account when we did our sprint planning! Duuuuuh.
Improved visibility: the rest of the world could see that we didn’t actually spend 2 weeks updating Facebook We failed to get much done on the new File Server
We got through more project work than we expected  
Easy to visualise the sheer amount of unplanned interruptions  
We prioritised our interruptions quite well  


Lessons Learned

  • 2 week sprints work well for the team’s focus
  • We should time-box research into upcoming projects
  • Any task which is above 5 points should be broken down into smaller tasks
  • We need to improve our estimation
  • We need to focus on completing the projects if we’ve committed to them
  • We need to take holidays into account!
  • Relative to interruptions, we can do more project work than we originally expected


Facts and Figures

  • We completed 103 points
  • 53 points of which were project points
  • 50 points were interruptions
  • 15 points were in progress at the end of the sprint
  • 9 points (of committed work) remained incomplete
  • 4.5 points were blocked


The Burndown

Friday to Tuesday were the least productive days in terms of project work. This was mainly due to hangovers holidays which “we” (namely me) hadn’t taken into account, with 2/3rds of the team being off at one point.

endbd


Conclusion

Sprint 1 was an enjoyable success within the team. The increased visibility of interruptions as well as a clearer focus on our tasks was refreshing.

We failed to deliver one project (the new file server), which is disappointing, and we will need to focus on progressing and completing our project tasks in future.

We’ll continue with Scrum for the time being.

The other thing we noticed was that interruptions take up more time than just the duration of the interruption. There’s an additional amount of time on top of each interruption which needs to be taken into account. When someone is being productive working on a project task which, let’s say will take 3 hours, and they get interrupted to do an IT request which may only take 1 hour, the total time for completing the project task PLUS the interruption isn’t going to be 4 hours. It’s more likely to be 5, and this is because it takes some time to get back to being fully productive.

We made a conscious effort not to measure tasks by elapsed time, and instead we tried to use “Level of Effort”. I thought that mapping points to hours would be a bit too convenient for observers to draw incorrect conclusions by just adding up the number of hours and comparing it against the number of points we achieved! By using Level of Effort points and taking into account the number of interruptions (at the end of the sprint the points showed us that we’d done an almost equal number of interruption points as we had done project points), it was clear that in future we need to buffer our estimations somewhat. 🙂


Agile ITOps: Day 4

It’s day 4 of our first agile ITOps sprint and so far it’s pretty much going to script. Our estimation of how much work we would be able to get through is looking roughly in the right ballpark (for more details on how we did the estimating, and other stuff see Agile ITOps: Day 1)

Looking at our sprint board a couple of things are fairly apparent. Firstly, that we were right about the number and frequency of interruptions, and secondly that we’re going to need a bigger board:

We’re going to need a bigger board

One of the things we aimed to achieve with the sprint board was to raise the visibility of the constant “interruptions” we have to work on. To do this we decided to note down every “interruption” on a red/pink card. As you can see in the picture above, we’ve worked more on interruptions than we have on our committed tasks. This was exactly what we expected to see.

Another thing we expected to see was a correlation between the number of interruptions we had, and the amount of project work we achieved. It was expected that on days where there were a high degree of interruptions, the number of project points completed would drop off. That hasn’t quite materialised yet, as you’ll see in the burndown below:

day4

2 Plus 2 Doesn’t Equal 4?

Another thing that we’re expecting to see is that the maths just don’t add up. What I’m saying is that I don’t expect the team to be 100% productive when you add up the completed tasks we committed to deliver, plus all the points we did on interruptions. The reality is that people can’t automatically switch from one task to another and not lose any productivity. At the end of this sprint I’m hoping to be able to get a rough estimate of this “lost time”. In due course I will try to see if there’s any relationship between the amount of “lost time” and the types of tasks/interruptions we work on, so that we can effectively “cost” some of our regular tasks.

Agile ITOps: Day 1

Today we started day 1 of our first ever ITOps sprint. This all came about because we needed a way of working out our productivity on “project tasks”, as well as learning how to triage our interruptions a bit better. None of the IT Ops team had tried any form of agile before, so there’s a mix of excitement and apprehension at the moment! I’ve opted for the old skool cards and sprint board (we’re using scrum by the way – more on this in a bit) rather than using an IT based system like Jira. This is mainly because everyone’s co-located, but also because I think it’s a good way to advertise what we’re doing within the office, and it’s an easy way to introduce a team to scrum.

The team already had a backlog of projects, so it was quite an easy job to break these down into cards. First of all we prioritised the projects and then sized up a bunch of tasks. We’re guessing, for this first sprint, that we’ll probably be around 40% to 50% productive on these project tasks, while the rest of our time will be taken up by interruptions (IT requests, responding to inquiries, dealing with unexpected issues etc).

Sprint 1 – planned, or “committed” tasks are on green cards, while interruptions go on those lovely pinky-reddish ones.

I’m using a points system which is roughly equivalent to 1 point = 1 hour’s effort. This is a bit more granular than you might expect in a dev sprint, but since we’re dealing with a very high number of smaller tasks, I’ve opted for this slightly more granular scale.

As well as project work, there was also an existing list of IT requests which were in the queue waiting to be done. I wanted to “commit” to getting some of these done, so we planned them in to the sprint. I had originally thought of setting a goal of reducing the IT request queue by 30 tickets, and having that as a card, but I decided against this because I don’t feel it really represents a single task in it’s own right. I might change my mind about this at a later date though! So instead of doing that, we just chose the highest priority IT requests, and then arranged them by logical groupings (for instance, 3 IT requests to rebuild laptops would be grouped together). At the end of our planning session we had committed to achieving approximately 40% productivity.

Managing Interruptions

We expect at least 50% of our time to be taken up by interruptions – this is based on a best-guess estimate, and will be refined from one sprint to the next as we progress on our agile journey. Whenever we get an interruption, let’s say someone comes over and says his laptop is broken, or we get an email saying a printer has mysteriously stopped working, then we scribble down a very brief summary of this issue on a red/pink card and make a quick call on whether it’s a higher priority that our current “in progress” tasks. If it is, then it goes straight into “in progress”, and we might have to move something out of “in progress” if the interruption means we need to park it for a while. Otherwise, the interruption will go in the backlog or in the “to do” list, depending on urgency.

At the end of the sprint we’re expecting to see a whole lot more red cards than green ones in the “Done” column. Indeed, we’re only a couple of hours into the first sprint an already the interruption cards contribute more than a 4:1 ratio in terms of hours actually worked today!

Interruptions already outweigh “committed” tasks by 4:1 in terms of hours worked – looks like my 40% guess was a bit optimistic!

Triage and Priorities

One of the goals of this agile style of working is to get us to think a bit smarter when it comes to prioritising interruptions. It’s been felt in the past that interruptions always get given higher priority over our project work, when perhaps they shouldn’t have been. I suspect that in reality there’s a combination of reasons why the interruptions got done over project work: they’re usually smaller tasks, someone is usually telling you it’s urgent, it’s nice to help people out, and sometimes it’s not very easy to tell someone that you aren’t going to do their request because it’s not high enough priority. By writing the interruptions down on a card, and being able to look at the board and see a list of tasks we have committed to deliver, I’m hoping that we will be able to make better judgement calls on the priority, and also make it easier to show people that their requests are competing with a large number of other tasks which we’ve promised to get done.

Why Scrum?

I don’t actually see this as the perfect solution by any means, and as you might be able to tell already, there’s a slight leaning towards Kanban. I eventually want to go full-kanban, so to speak, but I feel that our scrum based approach provides a much easier introduction to agile concepts. Kanban seems to be much more geared towards an Ops style environment, with it’s continuous additions of tasks to the backlog and its rolling process. I think the pull based system and the focus on “Work In Progress” will provide some good tools for the ITOps team to manage their work flow. For now though, they’re getting down with a bit of scrum to get used to the terms and the ideas, and to understand what the hell the devs are talking about!

Retrospectives, burn-downs and Continuous Improvement

We’ll stick with scrum for a while and at the end of our sprint we’ll demo what project work we actually got through, as well as advertise the amount of IT requests we did, and the number of “interruptions” we successfully handled (although I don’t think I’ll keep calling them “interruptions” :-)). I’m also looking forward to our first retrospective, which we’ll be doing at the end of each sprint as a learning task – we want to see what we did well and what we did badly, as well as take a good look at our original estimations!

I’ll keep track of our burndown, and as the weeks go by I’ll try to give the team as much supporting metrics/information as I can, such as the number of hours since an interruption, the number of project tasks that are stuck in “In Progress” etc. But most important of all, we’re looking at this as a learning experience, an opportunity for us to improve the way we manage projects and a chance for everyone to get better at prioritising and estimating.

I’ll keep the posts coming whenever I get the chance!